
INTRODUCTION
In a world gripped by debates around macro factors like virus waves, inflation, consumer purchasing health, and sector rotations, it may appear challenging to filter fact from noise. However, growing availability of data, powerful no code tools, and applying consistent and repeatable analytical process will provide significant benefit for decision makers who are bold and prepared.
Join us as we digest the following challenges and an opportunity:
- Challenge #1: With the explosion of data and software tools how is the decision process changing for stakeholders in the investment and corporate communities?
- Challenge #2: What examples of specific data and tools are available to add clarity in our efforts?
- Challenge #3: How can Consumer Trend data be used to understand macro impacts like consumer purchasing decisions, adjustments to infection rates or lockdown responses, or even inflation?
- Challenge #4: As the macro thematic changes how can we compare prior examples like the Covid Delta wave, rising interest rates, and impacts to Consumer purchasing decisions to predict reactions to the next exogenous drama?
- Opportunity: We believe that applying a disciplined and analytical process, using sophisticated no code tools and improving input quality will allow us to move from questions to hypothesis testing, to decisions.
Challenge #1
With the explosion of data and software tools how is the decision process changing for stakeholders in the investment and corporate communities?
The growth in available data and potential from analytics and artificial intelligence (AI) technology increases both the opportunity — and the challenge — for asset managers, investor relations professionals, and corporate management teams. Analytics can influence corporate decisions in product management, capital allocation, and how equity shareholders impact share pricing. The size and scope strains comprehension:
- Approximately 20 billion Internet of Things devices are now online. By 2025, the number is expected to rise to 75 billion devices.
- There will be 4.8 billion internet users by 2022, up from 3.4 billion in 2017. In fact, 80 percent of data will be unstructured by 2025.
- More stored data has been created in the last two years than in the history of mankind prior to that point.
- Financial services firms are increasingly using this data to predict business model outcomes and set equity prices. We continue to hear these statistics, but our eyes often gloss over given the challenge of understanding the disciplines required to integrate all this data.
Five skills and tools are needed to unlock the value of this data and use it to our advantage:
- Business knowledge of where value is created for the end customer.
- The devices and sources of data and their biases.
- Statistical and mathematical approaches to calculating what is known, and properly de-risking what is not.
- Technology software and architecture requirements.
- Cultural and organizational awareness and mutual respect for blending those respective skills into tangible workflow.
Thankfully, just as we saw with public cloud adoption, new “no code” tools and services are becoming available to make the scale and transparency of technology magic available to the business user who understands the core value proposition. Massachusetts Institute of Technology (MIT) calls the insight made possible by this technology “shared intelligence.”
Early adopters have the opportunity to separate from the pack as Amazon did with its public cloud computing service and successful e-commerce businesses. The COVID-19 pandemic creates a further imperative to take action on these opportunities.
APPLYING PROCESS IN FINANCIAL WORKFLOW
Can You OODA?
If driving performance is your objective, the OODA loop may provide a welcome model. The concept of feedback loops have become increasingly prevalent to digest and filter the mountain of data resources from noise into insight. As an example of applied process amidst an ever acting and reacting competitive environment, the U.S. military recognized that excellence in process may be one of the few sustainable areas of persistent advantage. Based on this realization, former fighter pilot and Pentagon tactician John Boyd created a straightforward framework called the OODA loop, which stands for Observe, Orient, Decide, and Act. “Time is the dominant parameter. The [operator] who goes through the OODA cycle in the shortest time prevails because his opponent is caught responding to situations that have already changed.” Now considered a foundational doctrine, it suggests that regardless of the backdrop, one must quickly and accurately:
- Observe (ingest data)
- Orient (solve for key performance indicators — KPIs)
- Decide (agree on primary objectives)
- Act (able to execute)
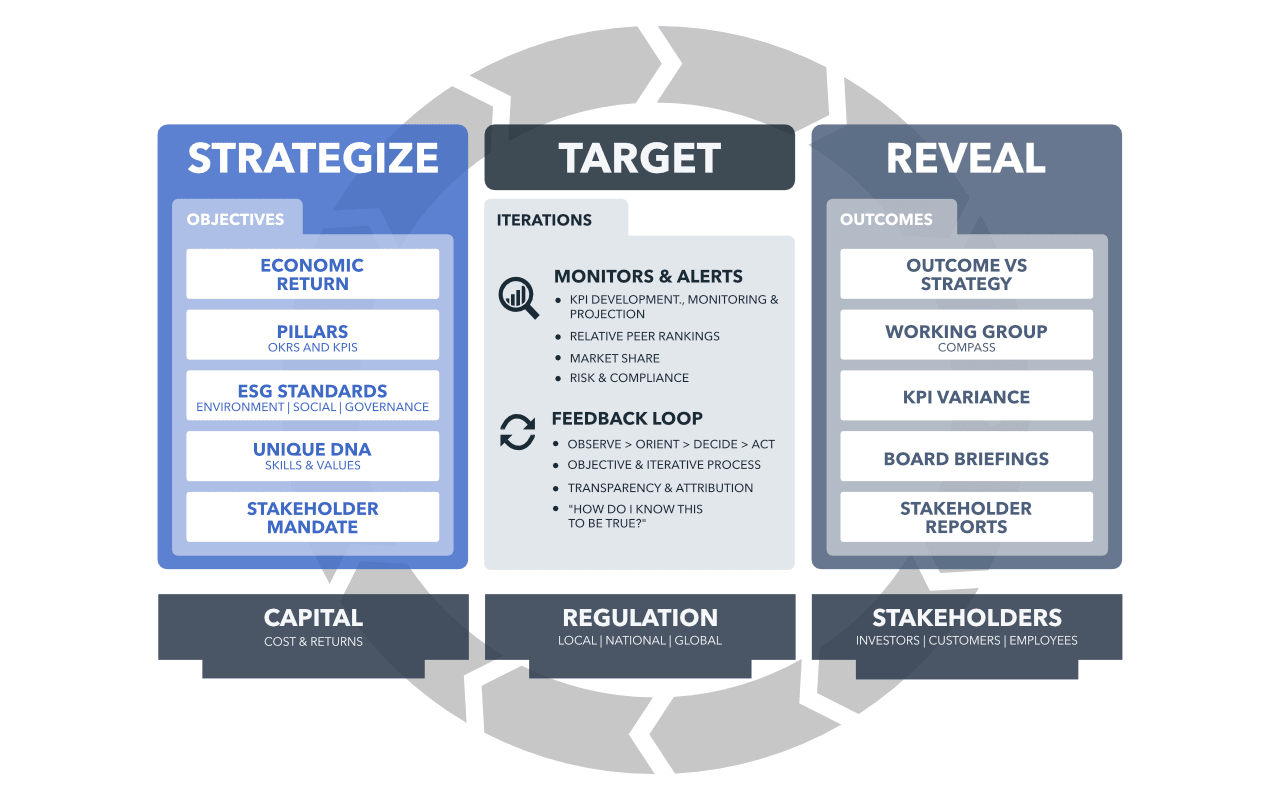
This framework hypothesis suggests the team most successfully cycling through this framework will learn and win while opponents are choking on the noise and confusion of exponential information growth. Process matters! For integration into our daily workflow, how can we integrate qualitative (human experience) and quantitative inputs into “shared intelligence?” The diagram above, “Fusing Data, Discipline, and Technology” demonstrates how an asset management group might implement the OODA loop concept. This serves as a decision-making framework for integration into portfolio management and monitoring. Further, it brings process and discipline to measuring and accounting for error rates in inputs as they work their way through calculation and review within workflows. On the left in the diagram we have inputs such as SEC filings, internal or external analysis (like consumer spending data), industry relationships, and qualitative experiences. In the next column there are estimates that will adjust to reflect the changing world around us. These input names may change with business model or vertical, but for asset managers, this drives top and bottom-line adaptation to operational key performance indicators (KPIs) and forward estimates. This is then reviewed based on portfolio risk parameters that may be as simple as a gut feel (controversial) or as sophisticated as rule-based or mathematical factor models. These steps culminate in a buy or sell decision and then the forward performance of the asset begins to show tangible outcomes (real and predicted). If our effort has been recorded in software, now the magic begins — we can check our initial assumptions against actuals and run feedback statistics, error rates, and increasingly complex machine learning on this real-time and growing resource of training data and intellectual property. This allows data and institutional learning to become integrated as a tangible asset we can build and grow.
TURNING QUESTIONS INTO PREDICTIONS
Peeling Back the Veil
In a moment of stark honesty, most organizations will admit they have never actually drawn out their decision process. The few that have done so may offer a flowchart to demonstrate that they have a roadmap.
However, if the inputs are not touching software and creating a time series of quantified changes, the effort is incredibly prone to narrative shift, hindsight bias, and lack of objectivity. Consequently, the ability for feedback loops or incremental learning will be severely compromised. It has been said, if software is eating the world, models will run the world. For those humble, confident, and willing to be held accountable, the tailwinds of technology can harness this tremendous potential in transparency, scale, and continued improvement on behalf of your stakeholders.
One of the largest shifts we are likely to see in team discussions during the next five years is toward analytics and data-influenced decisions. To do this, we must take our qualitative, thematic questions and turn them into key performance indicators — hypotheses which can be quantified, tested, and predicted (example shown in the following diagram). This process entails integrating the personal experiences of business users and operators and attaching their primary metrics to data consistently available.
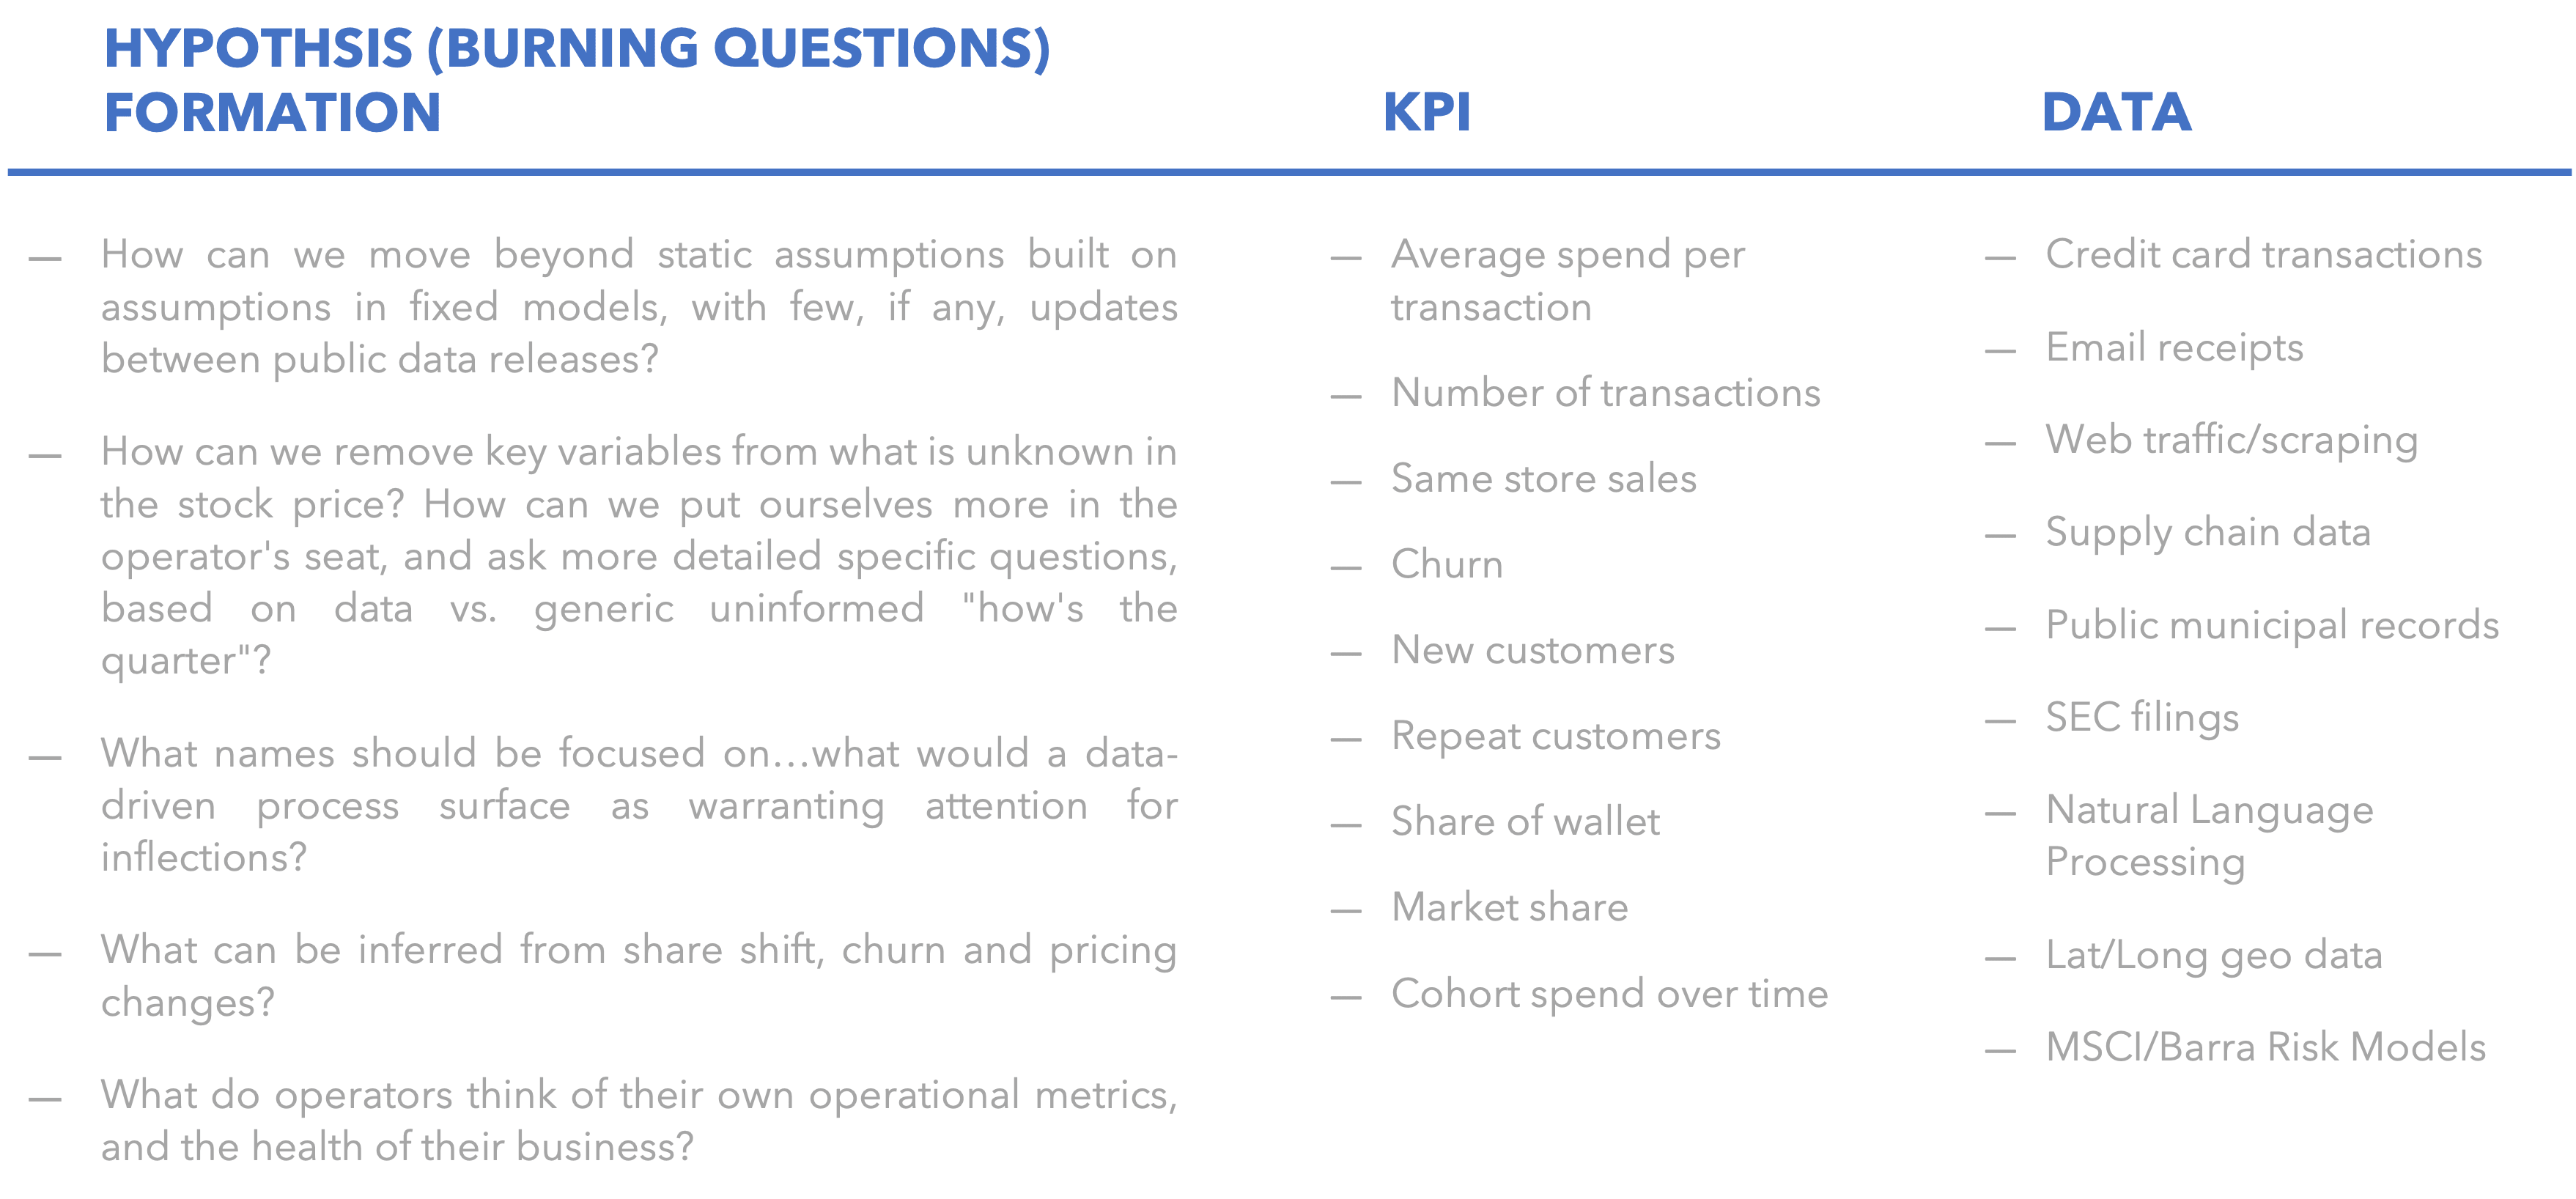
For the financial industry, analysts might answer questions about a company’s equity value by inferring revenue growth based on KPIs such as new customer growth, average spend per transaction, share of industry sales, and cohorts changing purchasing locations between physical and virtual storefronts. These may be seen within transaction records, email receipts, web traffic, or natural language processing queries of customer social media comments.
These discussions are often the same across corporate, private equity, and public equity uses, making a focus on defining, tracking, and predicting KPIs an increasingly universal language. Corporate intelligence and investor relations groups are likely to be a vital bridge between planning for resource allocation and explaining these key components to stakeholders.
Challenge #2
What examples of specific data and tools are available to add clarity in our efforts?
Turning now to specifics, we highlight two vendors we believe exemplify opportunity within data analytics. Their platforms include the following attributes:
Yodlee Consumer Trends
A Consumer Trends offering, covering: 30M + users, 17k+ data sources, 1,400+ organizations, 15 of the top 20 US banks, trillion$ in balances, 500M linked accounts, 200+ security audits (<24 months), Billions of transactions.
Demographic Granularity: 15M+ Users, normalization by overall panel user count, 600 tickers included, 2,931 brands, T+1 daily file by 6AM.
Payroll Analysis: Coverage for 4,600+ employers, reflecting 1,100+ tickers and 3,000+ private companies, Able to identify Weekly, Monthly, Quarterly paycheck periodicities.
Maiden Century’s IDEA Platform
Maiden Century’s IDEA (Integrated Dashboard for Everything Analyzable) is a data visualization/discovery/analytics platform.
With the vast amount of Yodlee data available, Maiden Century’s IDEA Platform provides a game changing, cloud-based platform for analytical users. After nearly 10 years in the making, encompassing 200,000+ man hours of research and programming, the interface provides seamless data ingestion, evaluation, back-testing, modeling, quality assurance, visualization out of the box.
As we know, data is a rear-view look into events that have already occurred or are occurring in real time. IDEA provides an intuitive and robust-featured UI that helps predict future events and trends. The IDEA Precast algorithm studies historical patterns and recent trends and offers multiple readily available (or internal proprietary) models to predict thousands of KPIs across 500+ companies for where each vendor’s data is headed over the next six months.
Leveraging IDEA for Macro Insights
Go Wide. And then Go Deep. IDEAs mapping taxonomy links dataset-specific merchant definitions to companies, companies to tickers and tickers to sectors and sub-sectors. This allows users to get as granular as they’d like or pull back to get a high-level overview of broader macro- or sector-specific trends. They also leverage a proprietary IDEA sector and IDEA sub-sector taxonomy that is more intuitive and granular than GICS / BICS.
IDEA also seamlessly integrates Visible Alpha’s street expectations into its analysis. Visible Alpha provides over 108,000 standardized line items, drawn from 125 contributing brokers, covering 6,000 companies, and processes over 81,000 models per quarter into aggregated key performance indicators. This shrinks prior manual tasks examining min, max, and average expectations and allows focus on accuracy, variance, and quantified sentiment.
Challenge #3
How can consumer trend data be used to understand macro impacts, lockdowns and infections…oh my!
Leveraging Yodlee Data and Maiden Century’s IDEA Platform, we’ll walk through the following four steps:
-
Develop a Macro Thematic View – Create an intuitive set of charts that represents the scenario
-
From Forest to Trees – Get specific to test theory and execute a decision
-
Yodlee Consumer Trends as a Barometer of Inflation – Formulating and testing a hypothesis
-
Generate Ideas or Manage Risk – Track watchlists and key metrics for portfolios or peers
As we began our discussion with current market macro challenges, many in the investor and corporate market intelligence communities may have underestimated the value of real time data from transactions and payroll to understand the impact and outcome of aggregated individual decisions. While we frequently hear buyside or corporate groups claim they aren’t trying to call weekly or even quarterly outcomes, they may be missing the forest for the trees.
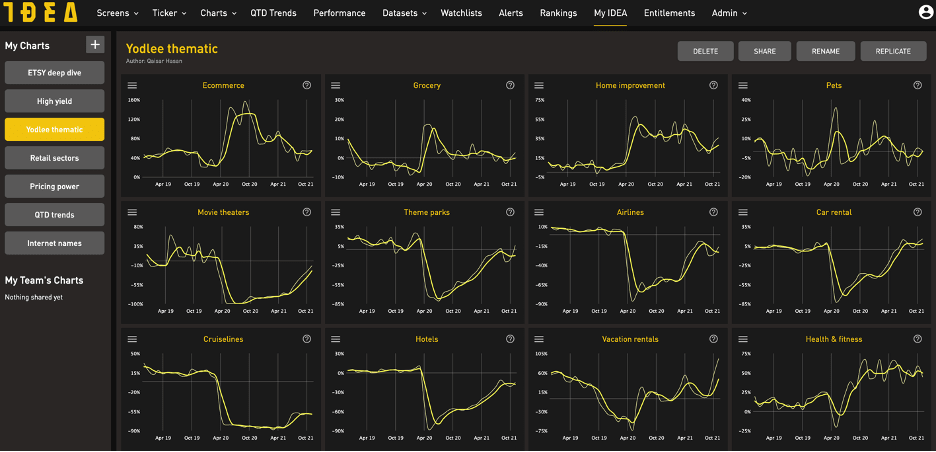
We believe the opportunity in this data is more about hypothesis testing and providing the right questions to ask. If an entire category of spending or employment data is rolling over, does it initially matter if an individual company represents the best house in a bad neighborhood? In the dashboard below, we show IDEA’s capability to create specific proprietary studies, either by category classification or individually defined thesis, to examine changes in the slope of demand and provide predictive indicators.
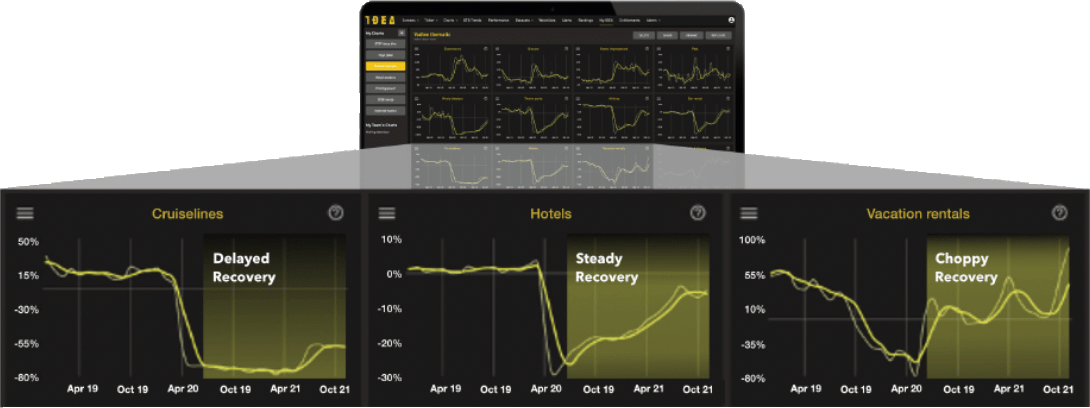
As we dive into the data, the first interface above shows overall spend across 12 different sectors. The four in the top row represent previous COVID beneficiaries. The others were primarily casualties of COVID, although there was significant divergence between Peloton and Planet Fitness initially, revealing the value in the Yodlee data of being able to go wide - then deep.
As the economy has improved, the timing and trajectory of rebound (or deceleration) has been difficult to predict as a change in incremental dollar spend; yet, this is graphically clear when analyzing the data. For instance, cruise lines recovery has trailed well behind airlines, while vacation rental sites like Airbnb and VRBO have improved much faster than short stay hotels, and movie theaters trailing behind theme parks given the dependence on movie theater chains. As we progress, we will walk through the deeper dive into analysis on these specific segments, diving into specific name analysis.
FROM FOREST TO TREES – MAKING THE THESIS SPECIFIC
As we move through our interactions with the data, saved studies, or monitoring of interest sectors we may want to examine specific industry names within the groups standing out as having the highest controversy or opportunity. Our focus could be on share of wallet spend, market share, commonalities in demographic group spend, relative performance, or new challengers.
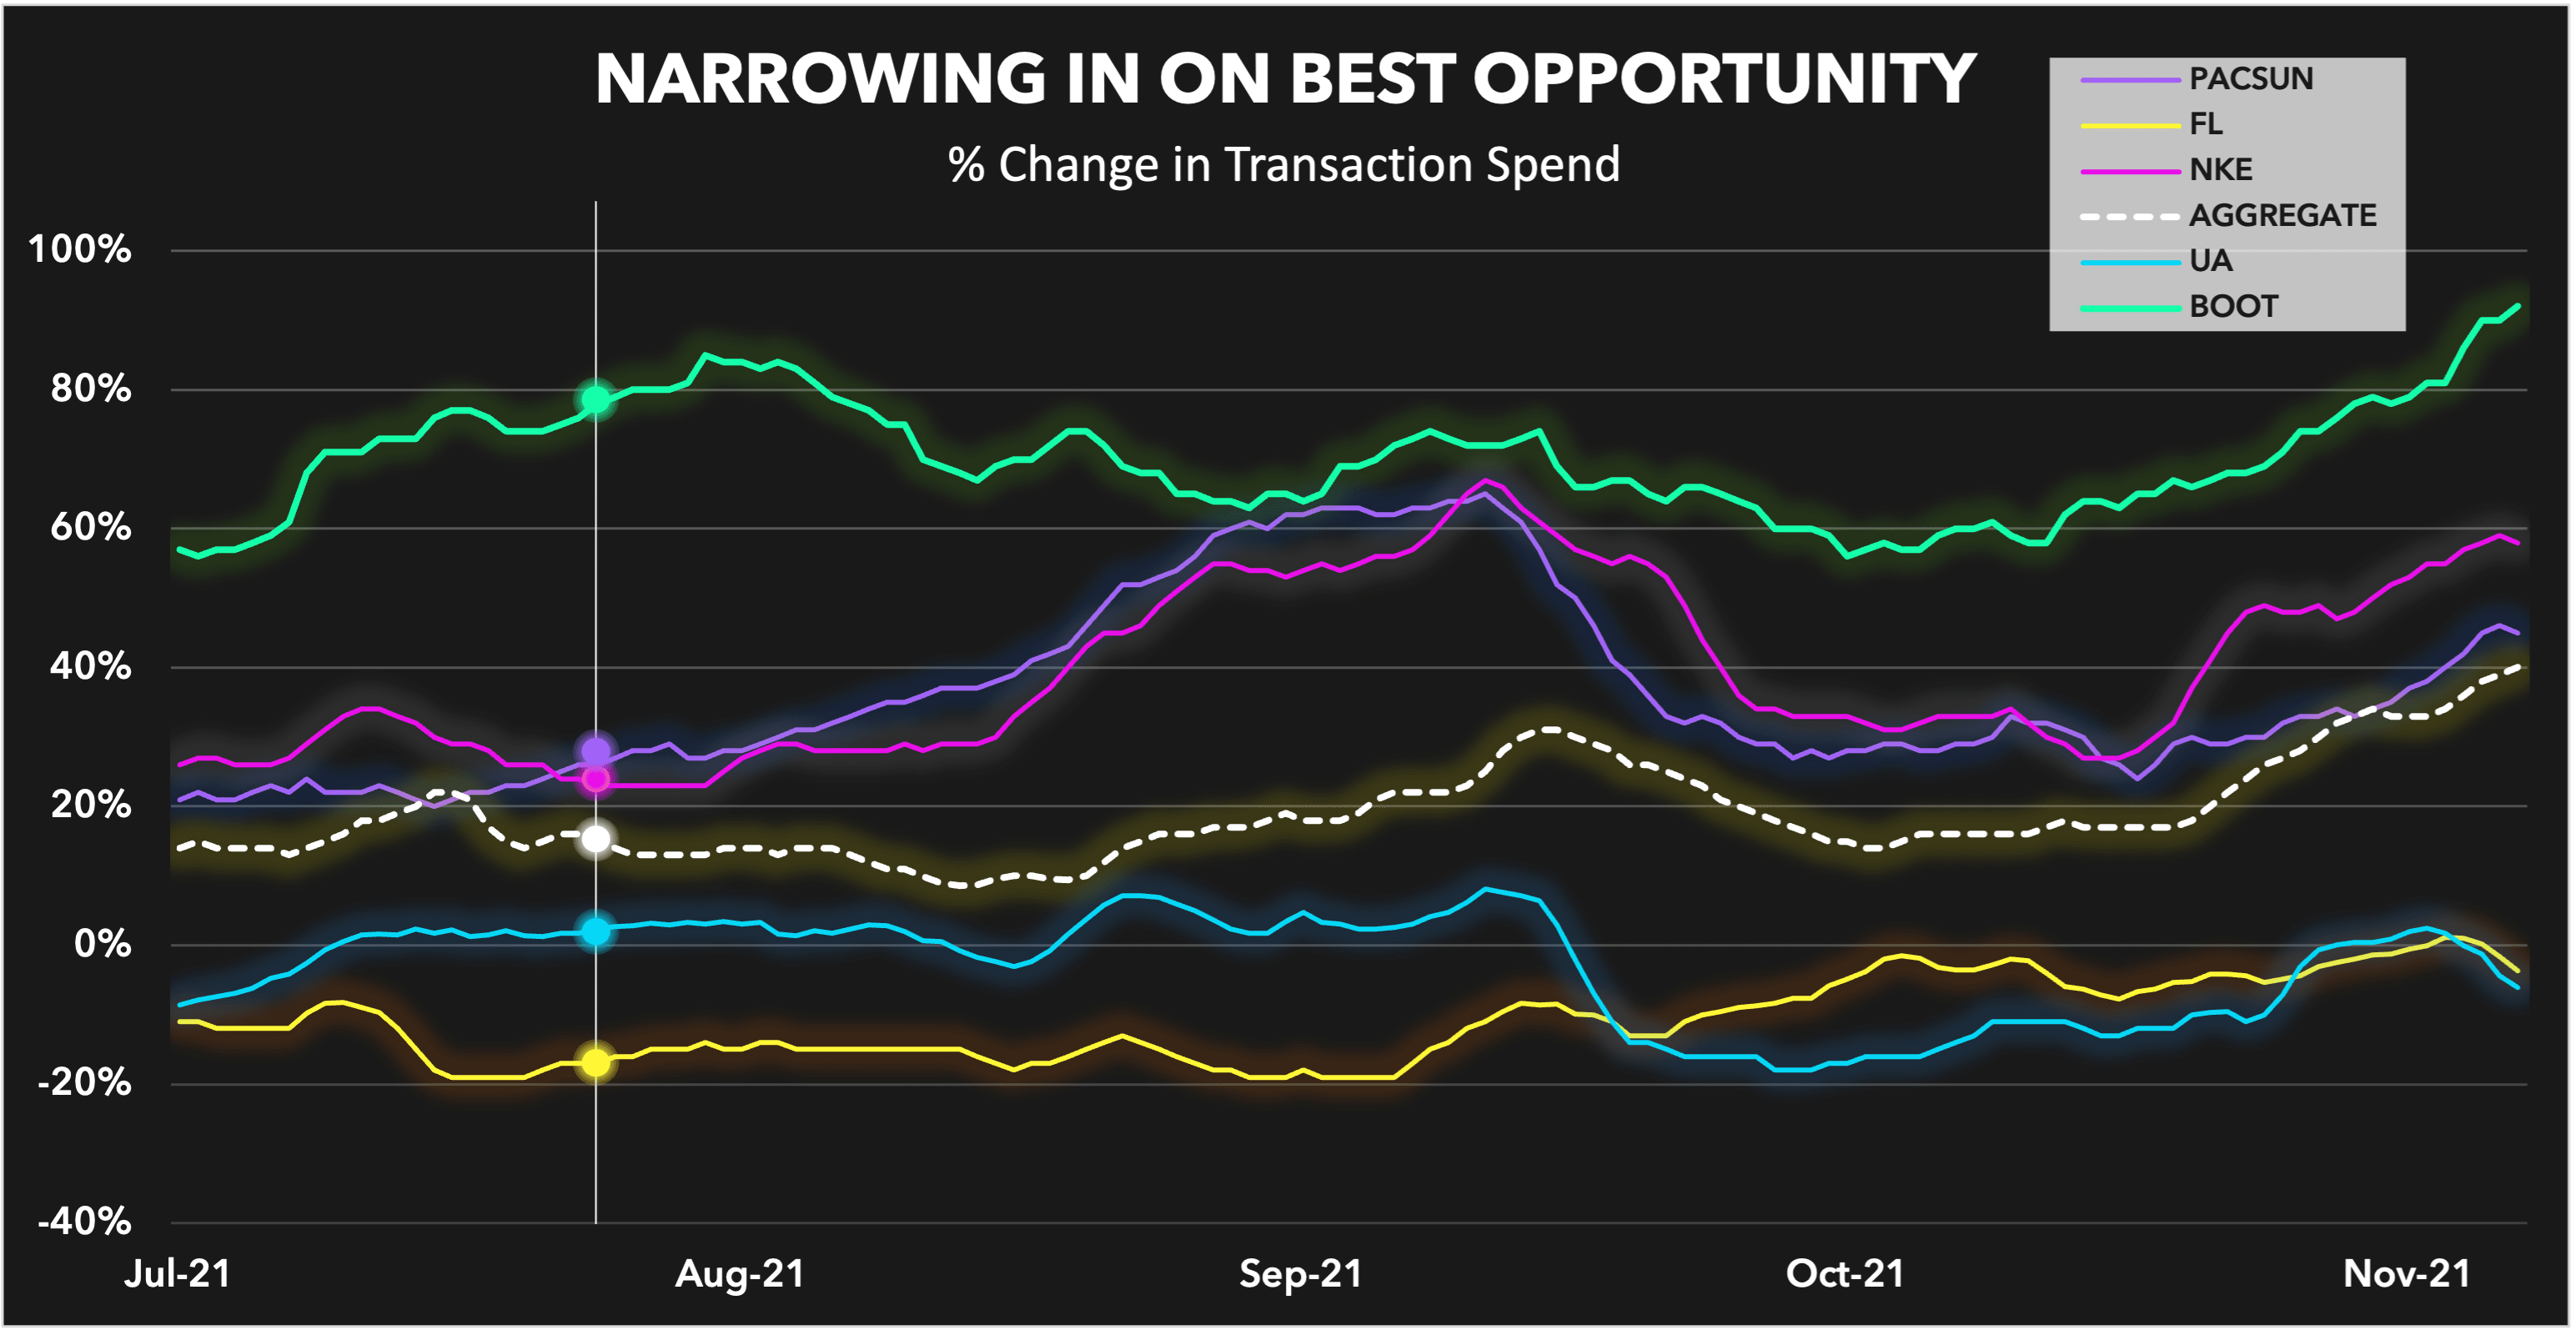
Given the controversy around the Covid impact to consumer retail and supply chain inventory, we narrowed our previous broader sector views to the figure above and a focus on Boot Barn (BOOT) vs its potential wallet share rivals for footwear.
Utilizing Visible Alpha consensus data, clients could use normalized spend data to track how the specific companies are performing relative to expectations.
In the example above, even after reporting upside to results for the 1Q-22 quarter (August 4, 2021), each weekly period through the remainder of FY2Q-22 continued to trend above the implied two-year growth rate of consensus revenues which were around 55%. As might be expected per the positive trends in the graph, the company reported Q3-22 results on 10/27 with revenue of $313.0 million well above street expectations (+69.5% Y/Y and +67.1% on a two-year basis). By early November, this continued outperformance supported a share price response for the period of our analysis well ahead (+36.8%) of the broader Consumer Consumer Discretionary benchmark (XLY +12%).
USING YODLEE CONSUMER TRENDS AS A BAROMETER OF INFLATION
In this second user interface, we are touching upon the wildly debated inflation theme, by switching from a total spend view to an average transaction price view. This is based on the Yodlee Consumer Trends, and takes total spend and divides by total transactions. It’s an informal proxy for pricing and inflation, though of course in some cases the numbers could also move up if average basket size was increasing (as happened with a lot of ecommerce names or grocers during the lockdown). It’s interesting to see how for a lot of travel and leisure related sectors, pricing appears to have peaked early in the summer of 2021, which could be a valuable piece of information to retain while looking into businesses impacted by seasonal trends. Movie theater chains, hotels and vacation rentals continue have pushed the boundaries more, perhaps driven by more limited inventory and wage pressures which these companies are looking to pass on. And while car rental prices are down from the peak in the summer, they’re still up a significant amount in absolute terms.
Maiden Century’s IDEA Platform provides us with a thoughtfully architected ability to adjust time frames, rolling averages, and various statistical measures. Here we are showing growth rates on a 2-year basis, to make them less volatile as we move into compares from a year ago and the extreme volatility it would show. The spend charts are monthly data points, with 1- and 3-month rolling average, so cover a longer time period where we can clearly see the sharp inflections in the middle as COVID was impacting the market. The pricing charts are on a shorter duration to allow us to focus on the post-COVID pricing trends and use a 13-week rolling average.
Many of these features have just recently been introduced and have significantly improved the story and communication effort within teams – as often one of the most difficult aspects of analysis and team-based decisions is conviction transfer. Further, these views can be saved by users, and provide email or platform alerts based on established user defined threshold curbs.
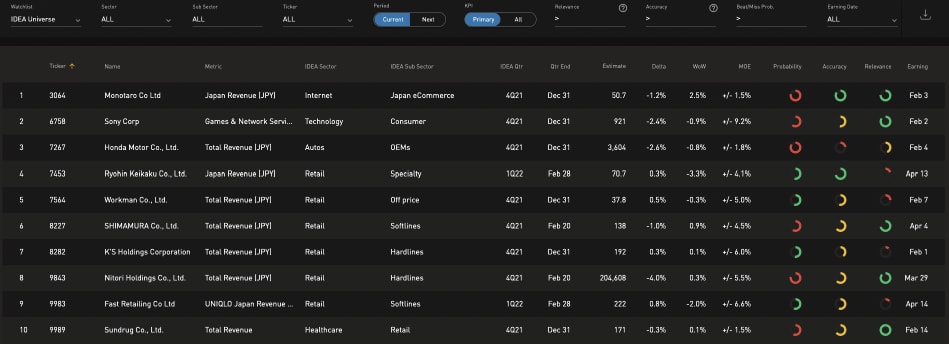
GENERATE IDEAS OR MANAGE RISK – TRACK WATCHLISTS AND KEY METRICS FOR PORTFOLIOS OR PEERS
While monitoring a specific company for its performance relative to street expectations is certainly a compelling use case, as cited above, leveraging available data and scaling sophisticated tooling, we can widen our scope and apply similar methodology to a much broader set of decisions.
As data inputs, KPI development, alerts, and asset health monitoring become more transparent and developed, we expect it will be a key component of idea generation and risk monitoring. In our view this should be a standard component to understanding the economic viability of an asset, its relative performance in market share, basket size, same store sales, pricing strategies, and marketing campaigns.
Corporates will be able to monitor the approach of competitors by volume and price, by correlation to other spending trends, and the encroachment of substitution products. Private and early growth equity users can utilize the data to monitor early stage or recovering brands to map cause and effect patterns relative to second and third derivative key performance indicators.
In the diagram above we show how managers and investors from their respective disciplines can use the data within a framework and time duration that is meaningful for them. Here we are monitoring the accuracy or variance of consumer trends relative to historical and predictive models, automatically prescribing various criteria per your internal data group preferences, highlighting divergences, and calling out trends. On the corporate or private equity side this may trigger a call to managers, industry experts, or incremental ad campaign spend. On the public equity side this could highlight risk or reward opportunity for your current portfolio or watchlists.
Challenge #4
As the macro thematic changes, how can we predict reactions to the next exogenous drama?
Beware wandering in an ocean of the latest “expert” talking head debates of macro opinion, which can be confusing and undisciplined. New questions are constantly arising, ever more relevant as the world becomes more globally driven and integrated. The ability to quickly formulate and test hypotheses is vital to a robust and agile process capable of navigating from forest to trees…and back.
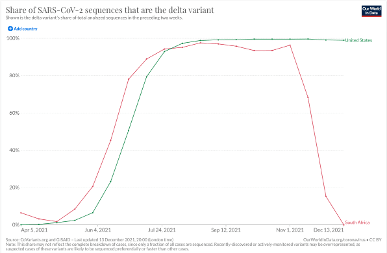
We are obviously experiencing the latest twist in macro saga - as shown in the chart above where the new Omicron COVID variant has exploded on the South African scene and cratered the Delta variant. Have consumers now risk adjusted their quality-of-life decisions and will look through the n’th wave – or will we return to last year’s stay-at-home playbook? Will we make bifurcated decisions not to give up on travel, but rather to prefer rental cars over airlines, and the embattled cruise lines? We believe the answers to these questions can be at your fingertips, and internal team debates focus on data, rather than conjecture or media hyperbole.
Opportunity
Conclusion and Call to Action
Reviewing these integrated solutions are a great conversation starter for asset managers, investor relations professionals, and corporate management teams. How are you developing your core key performance indicators, hypothesis testing, and decision processes? If this is only being done through aspirations and lip service, there are bold new tools available for your transition to a process-driven approach. Anduril Partners — in conjunction with its data and software partners — have developed processes and roadmaps which can guide your journey and cut time to value from years to hours. We look forward to the discussion.