Part 3 of 8
Can You OODA?
Thankfully for those with humility and a desire to drive consistent outperformance, the concept of feedback loops have become increasingly prevalent to digest and filter the mountain of data resources from noise into insight. As an example of applied process amidst an ever acting and reacting competitive environment, the U.S. military recognized that excellence in process may be one of the few sustainable areas of persistent advantage.
Based on this realization, strategy tactician John Boyd created a straightforward framework called the OODA loop, which stands for Observe, Orient, Decide, and Act. Now considered a foundational doctrine, it suggests that regardless of the backdrop, one must quickly and accurately:
- Observe (ingest data)
- Orient (solve for key performance indicators — KPIs)
- Decide (agree on primary objectives)
- Act (able to execute)
This framework hypothesis suggests the team most successfully cycling through this framework will learn and win while opponents are choking on the noise and confusion of exponential information growth. Process matters!

Applying Process in Financial Workflow
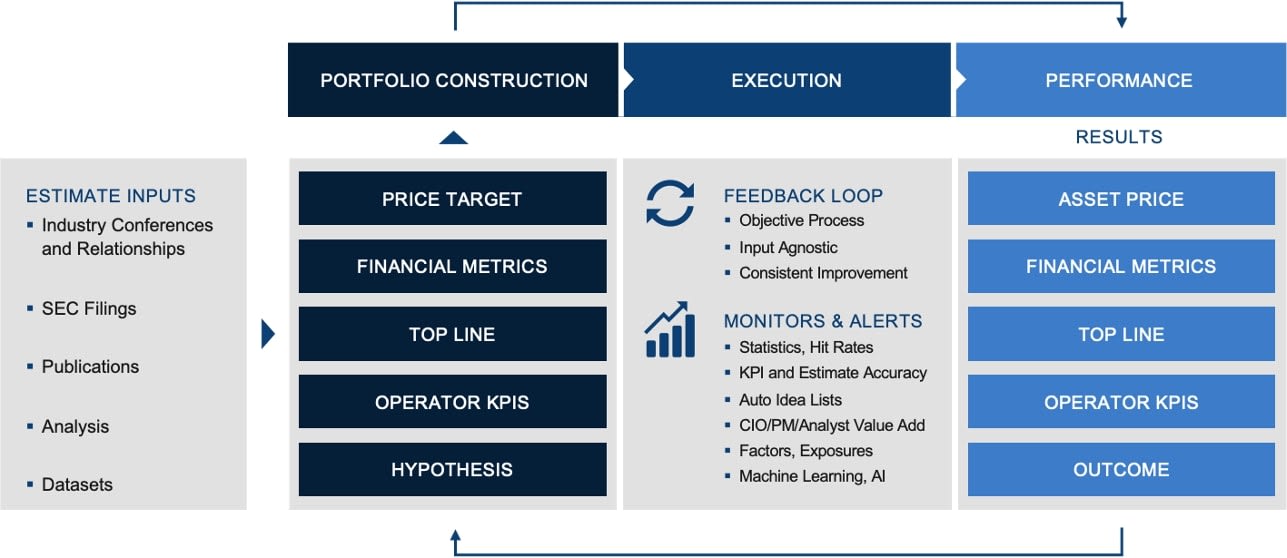
For integration into our daily workflow, how can we integrate qualitative (human experience) and quantitative inputs into “shared intelligence?” The chart above, “The Fusion of Data, Discipline, and Technology” demonstrates how an asset management group might add specificity to an OODA loop concept, driving decisions on which allocations to purchase, how they integrate as a portfolio, and how they might assess attribution and error rate per input function step — a historical “holy grail” challenge.
On the left in the diagram we have inputs such as SEC filings, internal or external analysis, industry relationships, and qualitative experiences. In the next column there are functions within systems that will change through manual or automated updates to reflect the changing reality of the world around us. These input names may change based on the business model, but for financial services groups, this drives top and bottom line changes to forward estimates and areas we believe to be operational KPIs to the asset related business model. This is then reviewed based on portfolio risk parameters that may be as simple as a gut feel (how most of business is actually done) or as complex as mathematical factor models.
These steps culminate in a buy or sell decision and then the forward performance of the asset begins to show actual outcomes. If our effort has been recorded in software, now the magic begins — we can check our initial assumptions against actuals and run feedback statistics, error rates, and increasingly complex machine learning on this real-time and growing resource of training data and intellectual property. This allows data and institutional learning to become integrated as a tangible asset we can build and grow.
Read another article in this 8 part series:
- Part 1: Introduction
- Part 2: The Importance of Storytelling
- Part 3: Applying Process in Financial Workflow
- Part 4: Turning Questions into Predictions
- Part 5: ESG: Making Good Intentions Real Through Great Process
- Part 6: What is Driving the Stock?
- Part 7: Blending Inputs, Feedback Loops and Implementing Metrics the Matter
- Part 8: Bringing it Home and Upgrading your Roadmaps